
Is It Still Worth It to Buy a Condo in Toronto, or Should You Just Rent?
With prices well off their peak, the case for owning has changed. It now comes down to two things: how long you'll stay, and which building you choose.
Yes, it can be worth buying right now, but only if you plan to stay at least five years and you buy the right unit. If you might move in two or three years, renting is probably the smarter play.
Here's why. First, prices have already come down a lot. TD says Toronto condo prices are about 25 to 30 percent below the 2022 peak. In the second quarter of this year, TRREB had the average GTA condo (which includes the suburbs) at around $635,000, down 7.5 percent from a year earlier. You're not buying at the top anymore. You're buying in a market where you've got negotiating power, choice and time.
Second, the math only works if you give it time. When you buy, you're paying closing costs, land transfer tax and legal fees up front. That money's gone whether you stay two years or ten. Stay long enough and paying down your own mortgage beats paying your landlord's. Leave too soon and renting usually wins.
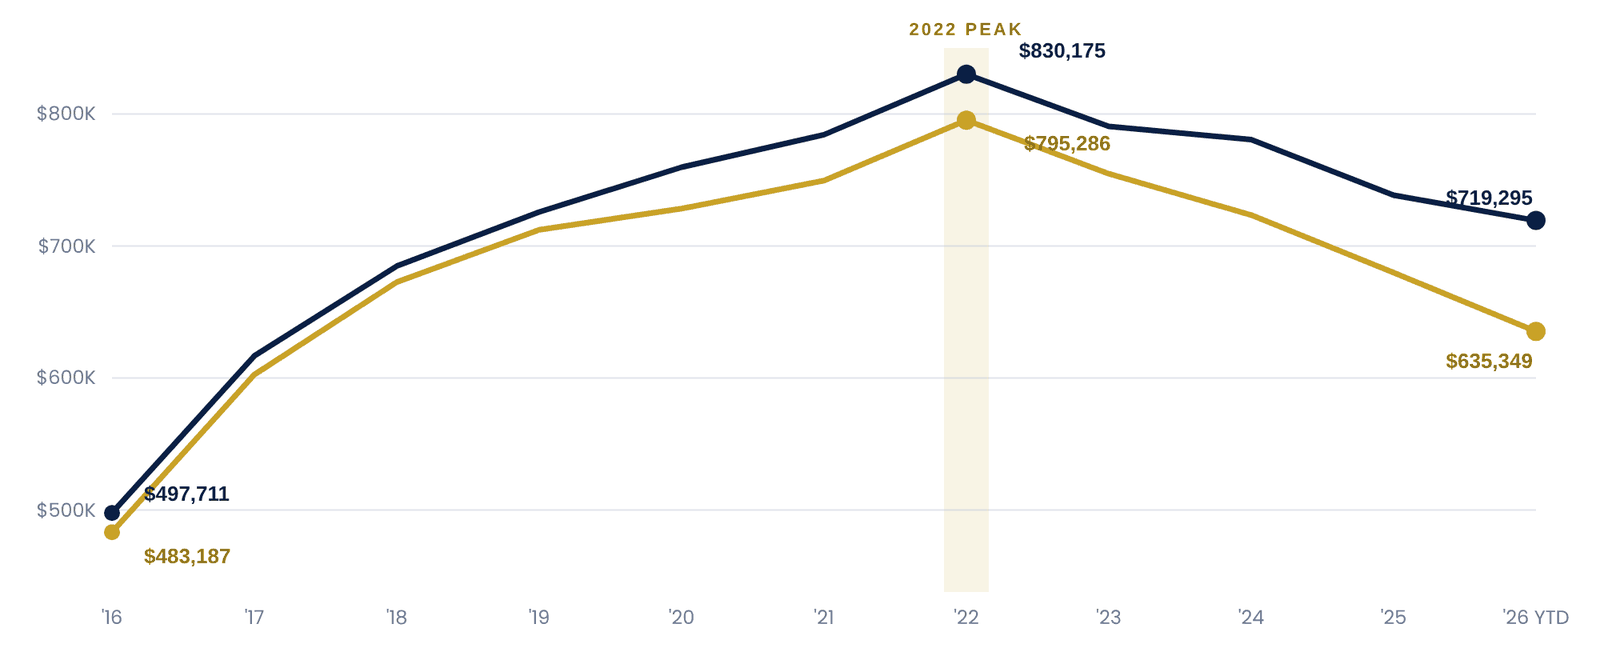
Downtown prices are still up 44% since 2016, and 13 to 20% off the 2022 peak
TRREB districts C01 (the downtown core) and C08 (the east side of downtown). The average C01 condo apartment went from $497,711 in 2016 to $830,175 at the 2022 peak, and sits at $719,295 for the first half of 2026.
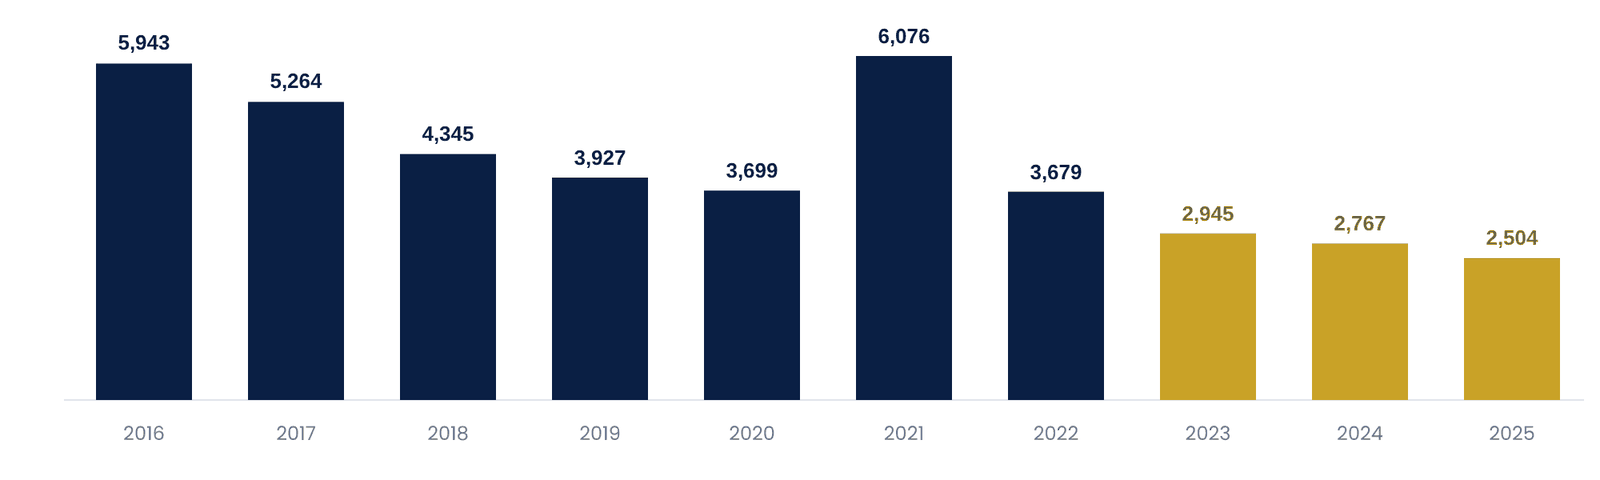
Fewer people are buying, too. C01 sales are down 58% since 2016.
C01 condo sales fell from 5,943 in 2016 to 2,504 last year. That's what gives today's buyers negotiating room: fewer competing offers, more listings to choose from, and sellers who've been waiting.
"Downtown condo prices are still above where they were in 2016, but they are 13 to 20 percent below the 2022 peak, and far fewer people are buying."
The suburbs tell the same story, only louder
In Oakville, Mississauga, Markham, Vaughan, Brampton and Ajax, the average condo apartment is now 19 to 31 percent below its peak year. Mississauga condo prices have fallen the most in dollar terms, from $681K in 2022 to $533K this year, and Mississauga condo sales have dropped by more than half since 2016. Markham condo prices are down 19 percent from peak, and Vaughan condo prices 21 percent, with sales in both well below where they were a decade ago. Brampton and Ajax, the two cheapest markets here, have fallen the hardest in percentage terms. Oakville condo prices are 22 percent off their 2023 peak, but Oakville is the exception on volume: sales held steady, which tells you buyers there are still showing up when the price is right.
1,472
684
799
261
446
55
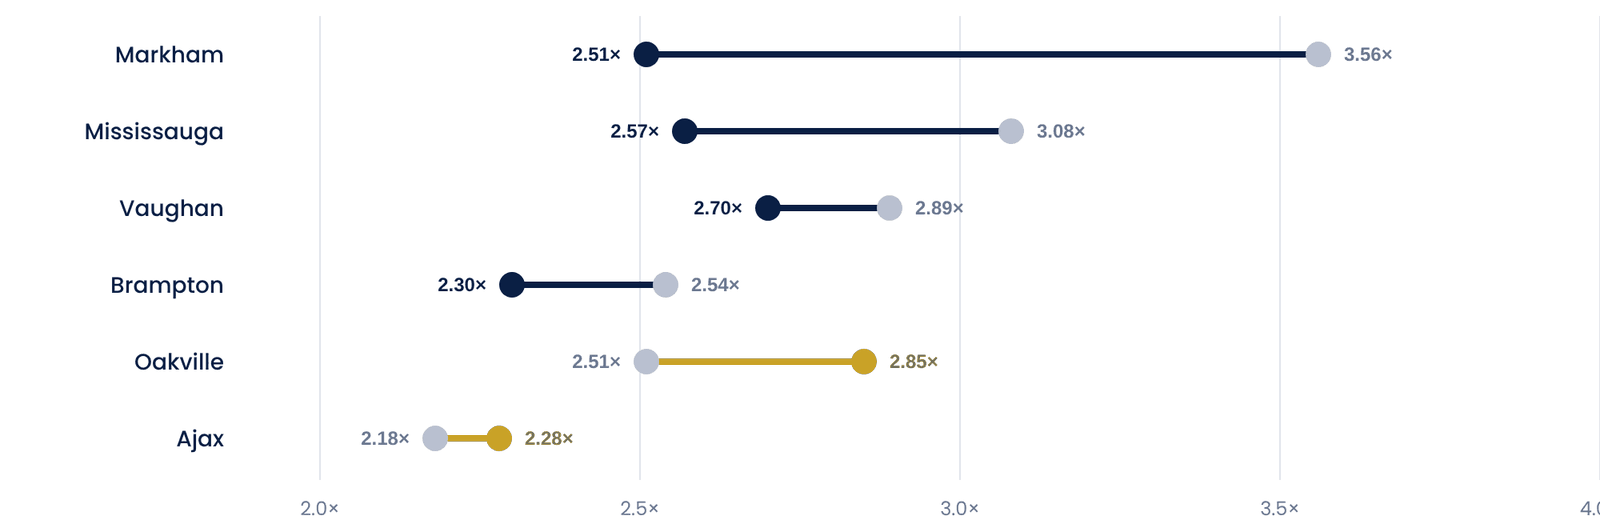
A condo hasn't become a cheap stand-in for a house. It caught up, then fell the hardest.
In 2016 a detached house in Markham cost 3.56 times the average condo apartment. Today it costs 2.51 times. The gap also narrowed in Mississauga, Vaughan and Brampton. It widened in Oakville and Ajax. For a first-time buyer in Markham or Mississauga, that means the step from a condo to a house is smaller than it was ten years ago, which is one more reason to get on the ladder now rather than wait.
| CONDO APTS | 2016 | 2021 | 2022 | 2025 | 2026 YTD | VS PEAK | SALES '16 | SALES '25 |
|---|---|---|---|---|---|---|---|---|
| Oakville | $500K | $746K | $844K | $712K | $662K | −22.4% | 418 | 446 |
| Mississauga | $318K | $586K | $681K | $559K | $533K | −21.7% | 3,379 | 1,472 |
| Markham | $387K | $666K | $761K | $677K | $617K | −19.0% | 1,340 | 684 |
| Vaughan | $423K | $658K | $748K | $636K | $589K | −21.2% | 934 | 799 |
| Brampton | $271K | $515K | $619K | $472K | $445K | −28.2% | 667 | 261 |
| Ajax | $301K | $555K | $620K | $517K | $426K | −31.3% | 123 | 55 |
Over ten years, condos kept pace with houses in most suburbs. Oakville and Ajax are the exceptions.
Price growth since 2016 for every home type. In Mississauga, Markham and Brampton the average condo apartment grew faster than the average detached house. In Oakville and Ajax, houses pulled ahead.
| AVG PRICE | DETACHED '16 | DETACHED '26 | SEMI '16 | SEMI '26 | TOWN '16 | TOWN '26 | CONDO '16 | CONDO '26 |
|---|---|---|---|---|---|---|---|---|
| Oakville | $1,255K | $1,889K | $693K | $1,056K | $715K | $1,099K | $500K | $662K |
| Mississauga | $978K | $1,370K | $618K | $903K | $612K | $908K | $318K | $533K |
| Markham | $1,376K | $1,548K | $800K | $1,046K | $760K | $1,038K | $387K | $617K |
| Vaughan | $1,223K | $1,590K | $750K | $1,030K | $745K | $1,031K | $423K | $589K |
| Brampton | $688K | $1,023K | $532K | $793K | $498K | $761K | $271K | $445K |
| Ajax | $657K | $971K | $530K | $791K | $498K | $751K | $301K | $426K |
Your time horizon matters more than timing the market
Downtown condo prices are 13 to 20 percent below the 2022 peak, and suburban condos are 19 to 31 percent below theirs. With sales down so sharply, buyers have more choice and more room to negotiate than they've had in years. But prices that fell for three years can also stay flat for a while. If you buy now, you need to stay long enough to earn back your closing costs.
You have to start somewhere. In 2002, I did.
I bought my first home as a first-time buyer in 2002: a 2,900-square-foot detached house with a double-car garage in Woodbridge, for $350,000. That same year, the average home sold through TRREB went for $277,375. Last year it was $1,067,715, nearly four times as much. A detached house in Vaughan now averages about $1.59 million.
If home ownership is a priority, and I think it should be, your first home doesn't need to be your forever home. It needs to be the one that gets you in. In 2002 that was a detached house. In 2026, for most first-time buyers, it's a condo.
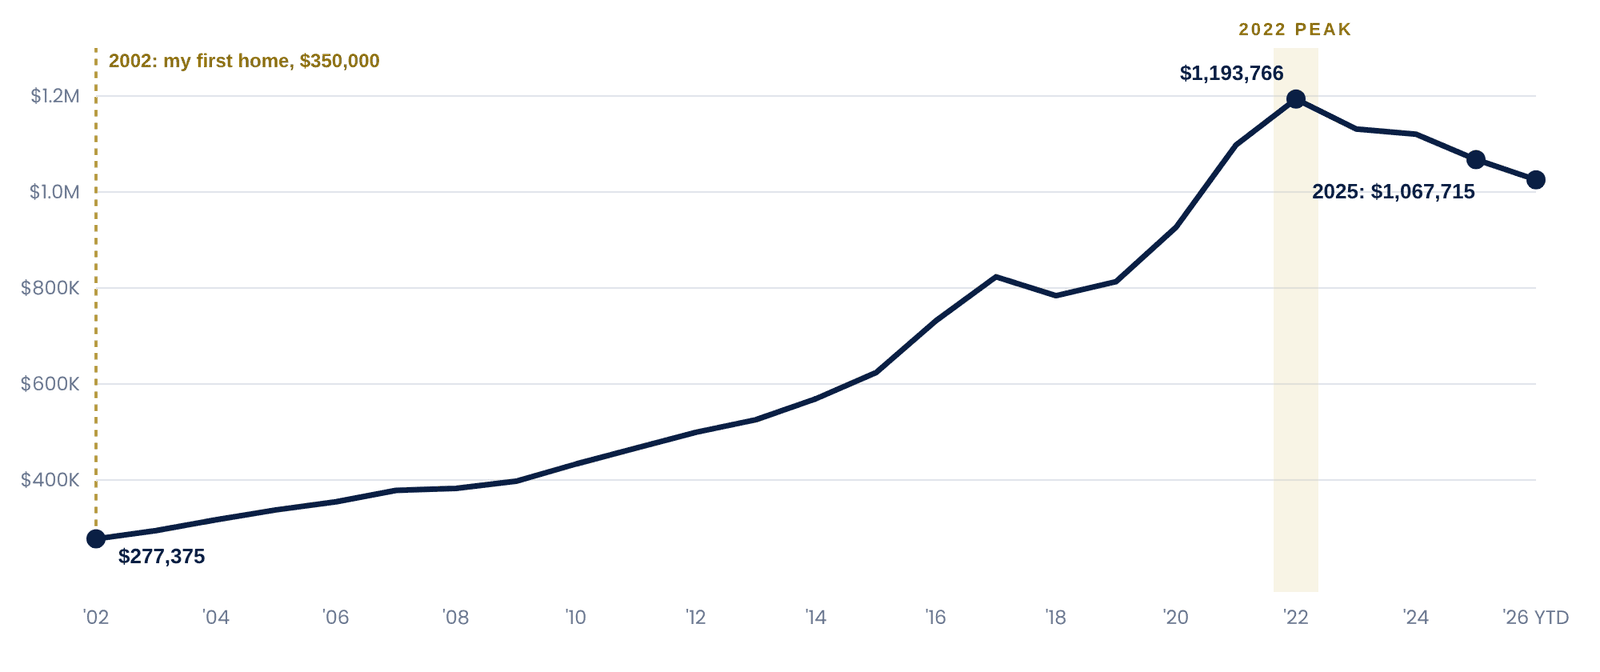
In 23 full years the average has dropped in only four, and three of those are the last three. That's the whole point. Dips like this don't come around often, and nobody rings a bell when they end.
One more thing: not every condo is a good buy
Before you fall in love with the view, look at three things. Tiny investor-style units are sitting on the market right now. Well-run buildings with real layouts are the ones holding their value.
If you're staying put and you pick the right building, this is one of the best windows to buy a Toronto condo in years. If you're not sure, rent and keep watching.
All C01, C08 and suburban figures come from the Toronto Regional Real Estate Board. Condo apartment figures are from TRREB's quarterly Condominium Market Reports, Q1 2016 to Q2 2026. Detached, semi-detached and townhouse figures are from TRREB Market Watch, January 2016 to September 2026. TRREB doesn't publish these annual totals, so annual figures are derived: sales are summed across quarters or months, and the average is total dollar volume divided by total sales. 2026 is year-to-date: January to June for condo apartments, January to September for other home types. Every source row was checked against TRREB's printed average. The TD estimate and the Q2 2026 GTA average are from their respective releases. The 2002 to 2025 annual averages for the whole TRREB MLS® System are from TRREB's published historic statistics; the 2026 year-to-date figure is from Market Watch, September 2026. The 2002 Woodbridge purchase is the author's own.
This article is for general information only and is not financial, legal or tax advice.