Will Toronto Condo Prices Keep Falling? What 20 Years of TRREB Data Says
Nobody can tell you the bottom. But Toronto has corrected three times in 20 years, and the first two tell you a lot about the one we're in.
Probably a little, and probably not for much longer. This correction is already the longest and deepest Toronto has seen in at least 20 years. Prices are still slipping month to month, but the pace has slowed, and every past correction ended while the headlines still said "worse to come."
"Will Toronto condo prices keep falling?" is the question I get asked more than any other right now, and I'm going to be honest with you: nobody knows the exact month prices stop falling. Anyone who says they do is guessing. What I can do is show you what happened the last two times Toronto corrected, line it up against today using 20 years of TRREB data, and let you decide how much more downside you think is left.
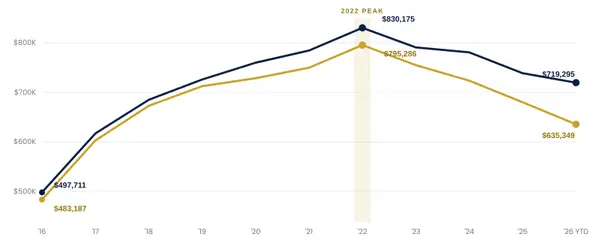
The GTA average selling price peaked at $1,334,544 in February 2022. In September 2026 it was $1,006,409, down 24.6 percent. The average condo apartment went from $799,966 to $605,257 over the same stretch, down 24.3 percent. So condos and houses have fallen about the same. That's unusual, and I'll come back to it.
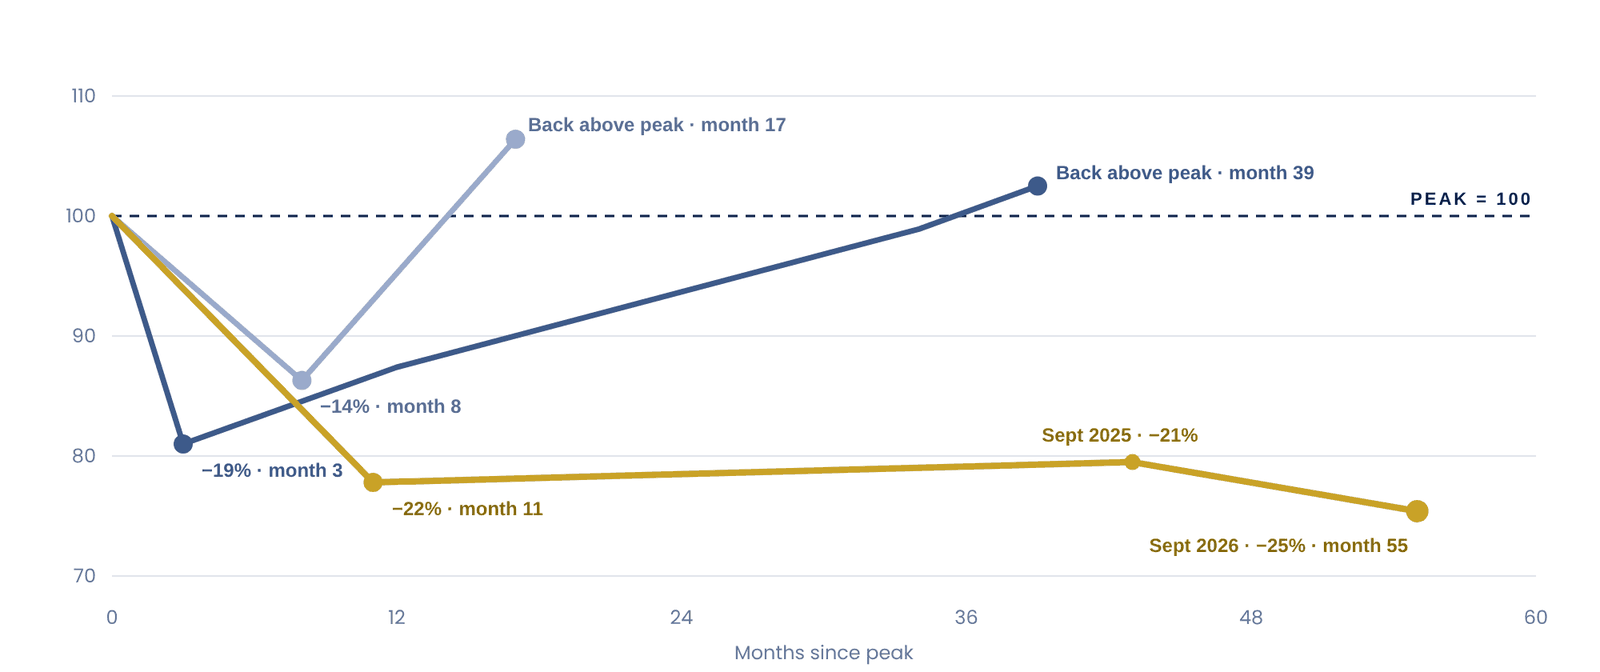
Toronto condo prices have corrected three times since 2006. This one is already the longest by a wide margin.
Each line starts at the month prices peaked (100) and tracks the GTA average selling price in the months that followed. In 2008 the market was back above its peak in 17 months. In 2017 it took 39. We are 55 months into this one and still below the low we hit in January 2023.
| CORRECTION | PEAK | LOW | DROP | MONTHS TO LOW | MONTHS TO RECOVER |
|---|---|---|---|---|---|
| 2008 financial crisis | $398,148 May 2008 |
$343,632 Jan 2009 |
−13.7% | 8 | 17 |
| 2017 Fair Housing Plan | $920,791 Apr 2017 |
$746,218 Jul 2017 |
−19.0% | 3 | 39 |
| 2022 rate shock (current) | $1,334,544 Feb 2022 |
$1,006,409 Sept 2026, so far |
−24.6% | 55+ | — |
What's different this time: condos fell with the houses
In 2017 the overall market dropped 12 percent year over year by April 2018, but the average condo apartment was up 3 percent. Condos were the cheap option buyers fell back to, so they held. This time they didn't. Between February 2022 and September 2026, condos fell almost exactly as much as the market as a whole.
Why? Two reasons. Investors owned a much bigger share of condos by 2022 than in 2017, and when rates jumped and rents softened, a lot of them became sellers at the same time. And the condos built between 2017 and 2022 skewed small, so the supply hitting the market was exactly the product fewer end-users wanted. That's why I keep telling buyers the building matters more than the market right now.
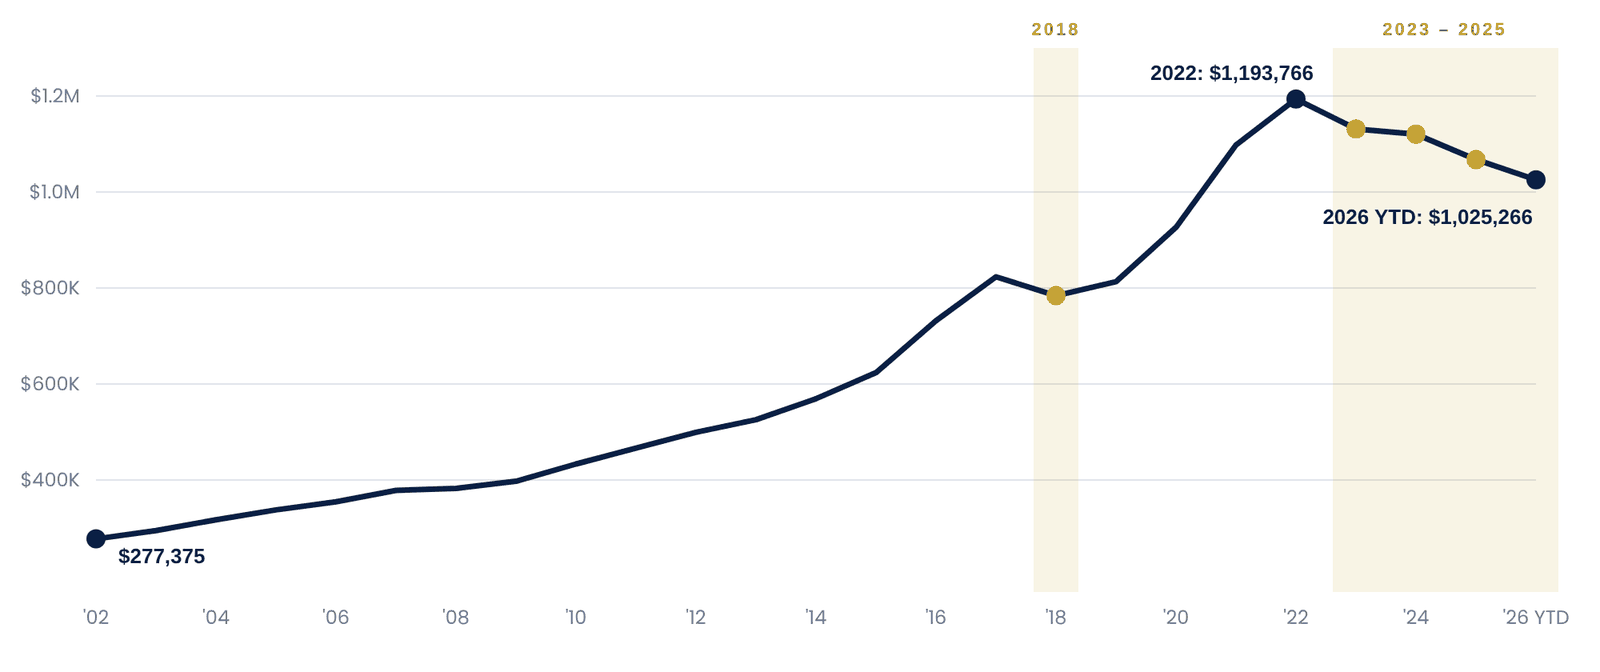
"In 20 years the average price has fallen in only four of them, and three of those are the last three. Corrections this long don't happen often, and they haven't lasted forever."
Zoom out and the dips are small next to the climb
The annual average fell in 2018, 2023, 2024 and 2025. Every other year since 2002 it rose. Even after a 25 percent correction, the 2026 average is still 3.7 times what it was in 2002 and above where it was in 2020.
Three signals that will tell us the bottom is in, before prices do
Prices are the last thing to turn. In both past corrections, these moved first.
So what do you do with this?
Prices may slip a little further. But this is already the longest and deepest correction in 20 years of TRREB data, and the leading signals are starting to turn. The risk of waiting is no longer smaller than the risk of buying.
Peak, trough and recovery figures are the GTA average selling price for all home types from TRREB Market Watch for May 2008, January 2009, October 2009, April 2017, July 2017, April 2018, February 2020, July 2020, February 2022, January 2023 and September 2026; September 2025 is derived from TRREB's reported year-over-year change. "Months to recover" is the first month the average closed above its prior peak. Monthly averages are not seasonally adjusted and are affected by the mix of homes sold; January figures in particular run low. Condo apartment averages are TRREB total (all areas) from the same reports. Annual averages 2002 to 2025 are from TRREB's published historic statistics; 2026 is January to September. Bank of Canada rate and bank forecasts as reported by Canadian Mortgage Professional, September 2026.
This article is for general information only and is not financial, legal or tax advice.
Categories